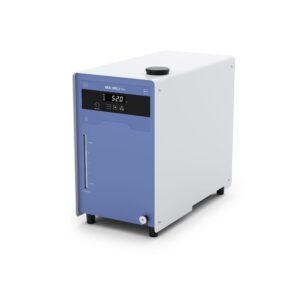

Diagram plotters continuously record measured values and visualize data as time-based charts. They are essential tools for documentation and analysis in laboratory and process measurement.
The following suppliers offer Diagram plotter products. Use the overview to compare suitable companies, brands and related product categories and send a direct request.
You can send a request to the suppliers listed above and save time. Describe your requirements and the request will be forwarded to the selected suppliers. They will contact you with suitable proposals without any obligation.
Diagram plotters are used to record measured values such as pressure, flow, or gas concentrations graphically over time, either on paper or digitally. This enables significant visualization and documentation of measurement data.
Key selection criteria include recording method (analog or digital), accuracy, number of channels, and integration options with measurement systems. The type of signal being monitored and the preferred output method determine the appropriate variant.
LabFinder provides a clear orientation to the diagram plotter category. Here you will find practice-oriented information for targeted product searches and can compare suppliers to select a suitable solution for measurement recording and data visualization.
Diagram plotters are used for the continuous recording of measured values from various sensors or measurement devices. They visualize these measurements as diagrams on paper or digitally, supporting applications such as process monitoring, environmental analysis, laboratory analytics, and metrology. The graphical display makes it easy to record, interpret, and document the progression of physical parameters such as pressure, flow, temperature, or gas concentration.
Important criteria when choosing a diagram plotter include the number and type of measurement channels, measuring range and accuracy, recording method (analog, digital, hybrid), and display medium (paper chart, screen). Connection options for sensor signals and interfaces for data transmission are also relevant. Other aspects such as portability, storage and evaluation resources, ease of operation, and maintenance requirements should also be considered.
There are analog diagram plotters, which operate using mechanical pens or needles on a chart paper, as well as digital models with electronic signal processing and digital display. Some devices combine both methods. Measurement signals typically come from pressure, flow, or gas sensors and are converted into electrical analog signals. For specialized applications, variants with a high number of channels or extended analysis functions are available.
Regular calibration ensures accurate and reproducible measured values. This involves checking the measured signals against known standards and making corrections if necessary. In analog systems, mechanical maintenance of the writing mechanism and paper transport is important. Digital devices require software updates and data backup.
Diagram plotters are mainly suitable for continuous measured values and less for discrete or very high-frequency measurements. Mechanical systems are limited in display resolution and are more susceptible to disturbances. Digital devices depend on the underlying sensor and signal format. For certain measurement tasks, alternative acquisition systems may be better suited.
Synonyms and search terms include: recorder, chart recorder, registration device, plotter, diagram recorder, data recorder, pressure recorder, paper chart recorder, measurement diagram plotter, analysis diagram plotter.
A diagram plotter receives measurement signals, such as electrical analog signals, from sensors and records them continuously as diagrams on paper or digitally. This graphically displays time-dependent measurement trends.
There are analog diagram plotters, which mechanically draw on paper, and digital models, which process and visualize measurement data electronically. Some devices combine both methods.
Key factors include the number of measurement channels, the recording method, the type of measured quantity to be displayed, interfaces for sensors and data, accuracy, and the intended application.
Calibration involves comparing measured values to standard references and adjusting the display if needed. Mechanical components require regular maintenance, while digital devices need software updates and data backup.
Mechanical systems are limited in resolution and speed. Digital devices require compatible sensor signals. For discrete or very fast measurements, specialized acquisition systems are more suitable.
Present your company on LabFinder and be listed for this product category as well as suitable related categories and brands.